Design, Science and Technology
45.8K views | +5 today
Follow
Design, Science and Technology
#ideas #design #science #technology #inspiration #media #information
Your new post is loading...
Rescooped by Antonios Bouris from visual data
Scoop.it!

Hot Spots: Mapping the World's Most Photographed Locations

Hot Spots: Mapping the World's Most Photographed Locations | Design, Science and Technology | Scoop.it

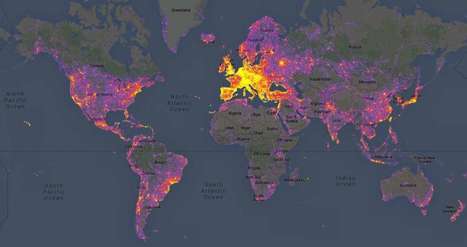
Sightsmap forms an aggregation of the most photographed buildings by integrating Google's Panoramio, which allows users to tag a location or attraction within their photo.


In a colorful gradient of purples, reds, and yellows, the website reveals the most photographed places around the globe. Broad patches of purple coincide with a lesser amount of photographs, while smaller clusters of yellow reveal the locations where people can't seem to put their cameras down. Unsurprisingly, the densest areas of yellow are the world's most popular tourist spots − including New York City and cities across Europe such as Istanbul.

Sightsmap is more than just a map of tourist destinations however; it also shows the close connection between architecture and what inspires people to take photos. Sightsmap forms an aggregation of the most photographed buildings by integrating Google's Panoramio, which allows users...


Via Lauren Moss
No comment yet.
Rescooped by Antonios Bouris from visualizing social media
Scoop.it!

Infographic: Watch Tweets Appear Worldwide in Real-Time

Infographic: Watch Tweets Appear Worldwide in Real-Time | Design, Science and Technology | Scoop.it

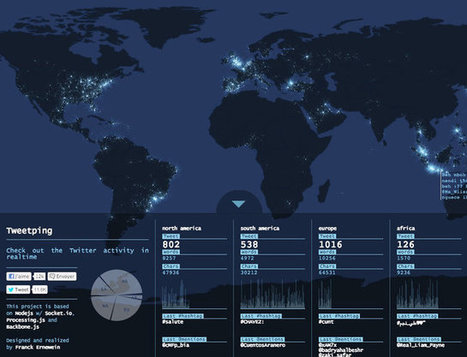
By Franck Ernewein, Tweetping is a map that shows where everyone in the whole world is tweeting from in real time.


Much like Poptip’s treatment of Twitter, you’re not really meant to follow it all. Country-by-country tickers do track the total tweets, words, and characters sent since you signed on, but hashtags and @-mentions flash for milliseconds, constantly replaced by a stream of data that can’t be paused for a moment, lest the system fall perpetually behind. Meanwhile, the geolocations of each tweet make their way to a world map as a glowing dot. As the tweets pile up, so do the dots, meaning the world transforms from prehistoric shadows to blindingly bright connectivity in a matter of minutes.


Via Lauren Moss