IPAD, un nuevo concepto socio-educativo!
51.2K views | +0 today
Follow
IPAD, un nuevo concepto socio-educativo!
El Mobile learning en su verdadero potencial!
Curated by juandoming
Your new post is loading...
Rescooped by juandoming from Education Technology - theory & practice
Scoop.it!

Teaching With Infographics

Teaching With Infographics | IPAD, un nuevo concepto socio-educativo! | Scoop.it

"This past week I taught a few classes on infographics and decided to update the page by adding a section called "Teaching With Infographics". It is important for your students to make sure that they evaluate any infographics they are using, by making sure the author/creator has cited their references. Misinformation on the web exists. Have students read these tips to make a better infographic."


Via Beth Dichter, Lyudmila Anikina, Timo Ilomäki
Beth Dichter's curator insight, February 8, 2014 7:45 PM

The Media Specialist has recently updated her information on teaching with infographics. This post provides many great resources including a post on tips to make better infographics, an in-depth video on teaching with infographics, a series of videos that detail how to use Piktochart to create infographics, and many other resources. If you are considering having students create infographics check out this post for resources.

The Rice Process's curator insight, February 9, 2014 10:35 AM

Very helpful and great tips to follow.

Claudia Estrada's curator insight, February 23, 2014 2:56 PM

Working with info graphics has become an important skill now a days because new generation reads better images with less text.  Helping students to become good users of it is developing 21st. century learners.   

Rescooped by juandoming from 21st Century Learning and Teaching
Scoop.it!

Smartphone and Mobile App Usage [Infographic]

Smartphone and Mobile App Usage [Infographic] | IPAD, un nuevo concepto socio-educativo! | Scoop.it
The Smartphone App Usage showcases the smartphone user behavior. This infographic will also take you through the world of mobile applications and provide you with rich insights and statistics on the popular app categories and mobile games.

Via Gust MEES
Gust MEES's curator insight, March 15, 2013 9:29 AM


A MUST have infographic...


Jacqui Sharp's curator insight, March 15, 2013 4:30 PM

Clear, well laid out infographic with statistics and recognisable graphics and icons. Lots of great information. Would cause a lot of discussion in a classroom.

James J. Goldsmith's comment, March 18, 2013 7:17 PM
Does what a good infographic should do - provides a lot of useful information in an aesthetically pleasing way that can be quickly understood.
Rescooped by juandoming from Measuring the Networked Nonprofit
Scoop.it!

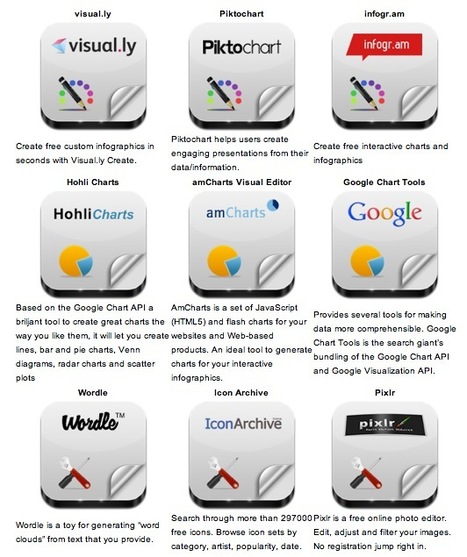
Infographic Builders: 9 Free Tools To Create Great Visual Charts

Infographic Builders: 9 Free Tools To Create Great Visual Charts | IPAD, un nuevo concepto socio-educativo! | Scoop.it

Robin Good: Here is a handy short guide to nine free infographic creation tools that can be utilized to create enticing visuals, word charts and data-based infographics without having special technical skills.


Useful. 8/10


Check them all out: http://www.infographicsarchive.com/create-infographics-and-data-visualization/ ;


(Unearted by Andres Taborga)


Hey All -- sometimes in business we need to display/convey data with our storytelling. So how do you display data in engaging ways? I love this article because it shares 6 free tools to use, plus there's a little tutorial on how to make infographics.


We all know how important it is to have the right tool for the job at hand. Bookmark this article so when you need the tools you have them. Enjoy playing with your numbers and showing them in different ways!


Thank you Robin Good for curating this article.


Via Robin Good, Beth Kanter
Trude Burnett's curator insight, May 9, 2014 3:48 PM

Good tools to make Infographics

becool's curator insight, May 4, 2015 6:40 AM

Infographics voor zij die er nog steeds zot van zijn.

Sahana Chattopadhyay's curator insight, May 4, 2015 11:59 PM

Infographics are great tools to present curated and focused content from a specific perspective. 

Rescooped by juandoming from 21st Century Learning and Teaching
Scoop.it!

The 50 Most Popular Books For Teachers [Infographic]

The 50 Most Popular Books For Teachers [Infographic] | IPAD, un nuevo concepto socio-educativo! | Scoop.it
What are the best books for teachers? What are others reading? This new infographic visualizes exactly that and should be great for any teacher!


Read more, a MUST:

http://edudemic.com/2012/12/best-books-for-teachers/


Via Gust MEES
No comment yet.