Your new post is loading...

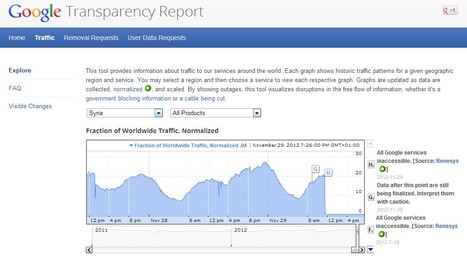

This tool provides information about traffic to our services around the world. Each graph shows historic traffic patterns for a given geographic region and service. You may select a region and then choose a service to view each respective graph. Graphs are updated as data are collected, normalized
, and scaled. By showing outages, this tool visualizes disruptions in the free flow of information, whether it's a government blocking information or a cable being cut.
Via Gust MEES