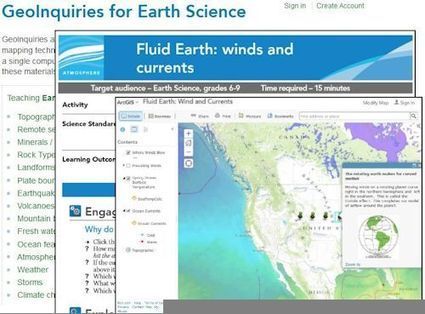

"The 2015 Earth Science Week (Oct 11-17) theme is 'Visualizing Earth Systems.' Esri’s Earth Science GeoInquiries help educators show and explore critical content in earth science."
Tags: physical, mapping, geospatial, ESRI.
Get Started for FREE
Sign up with Facebook Sign up with X
I don't have a Facebook or a X account


 Your new post is loading...
 Your new post is loading...
Your new post is loading...
"The 2015 Earth Science Week (Oct 11-17) theme is 'Visualizing Earth Systems.' Esri’s Earth Science GeoInquiries help educators show and explore critical content in earth science."
Tags: physical, mapping, geospatial, ESRI. 
No comment yet.
Sign up to comment
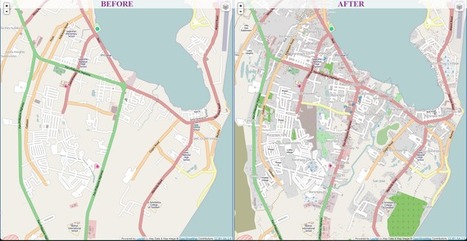
Volunteers across the world are building the digital infrastructure for the organization's Typhoon Haiyan relief efforts Want to see geographic knowledge and geospatial skills in action? Crowd-sourced mapping is increasingly an important resource during an emergency. Poorer places are often not as well mapped out by the commercial cartographic organizations and these are oftentimes the places that are hardest hit by natural disasters. Relief agencies depend on mapping platforms to handle the logistics of administering aid and assessing the extent of the damage and rely on these crowd-sourced data sets. Can you join in and help?

Tony Aguilar's curator insight,
November 13, 2013 3:32 PM
online maps are being used to help locate the best way possible to help transport food and resources to those most in need. They van locate bridges and the world is pulling together with tehcnolgy and accurate maps to help the American red Cross maximize in time and manpower. It seems that after Hurricane Katrina and the Earthquakes in Haiti and Japan, We have been improving our strategies for how to best help people around the globe come together put our time energy and resources together to best help people whose lives have been devasted and crushed by the forces of mother nature.

Tracy Galvin's curator insight,
May 3, 2014 7:14 PM
Having a map of the current landscape, after the typhoon will speed up relief and rescue efforts by showing areas to land and set up help stations. The digital world is immediate now and this will change how organizations such as the Red Cross provide relief to suffering people.
Seth Dixon's insight:
This is a simplified Census data map viewer specifically for Rhode Island. To see a simplified U.S. Census data at the national scale, see: http://sco.lt/7G5rur Tags: statistics, Rhode Island, census, GIS, mapping, cartography.
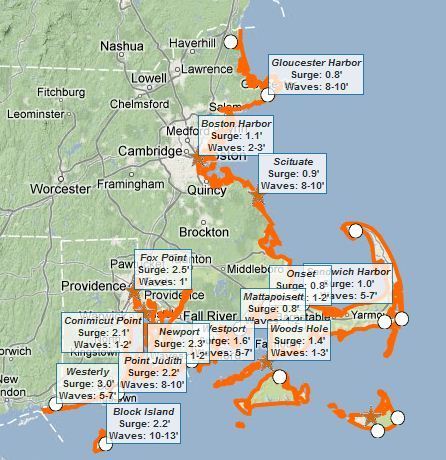
This interactive map of coastal Massachusetts and Rhode Island shows some basic flooding data including: 1) where are the flood warnings (essential the entire coastline), 2) how high the storm surge is, and 3) how high the waves are. Tags: Rhode Island, water, disasters, geospatial.
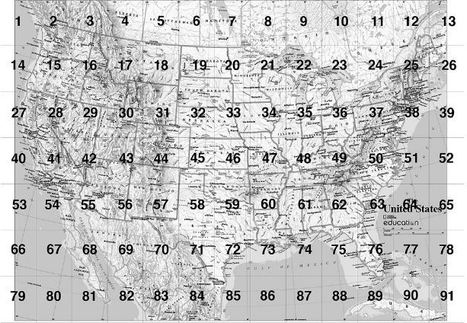
MapMaker Kit. Download, print, and assemble maps of the United States in a variety of sizes. The mega map occupies a large wall, or can be used on the floor. Have you every wanted to create a giant map but aren't sure if you can logistically pull it off? The National Geographic's MapMaker kit is just that, a kit for you to create wall maps from a standard printer and tile them together. The assembly itself is a great spatial thinking and fun exercise for students (and there are large world maps as well). Tags: NationalGeographic, cartography, mapping, K12.
|

"Explore ten 'big ideas' that encapsulate the technological and social trends that have pushed geographic information systems (GIS) onto the Internet in a significant way. See how to apply these ideas to your own world. Open your eyes to what is now possible with Web GIS, and put the technology and deep data resources in your hands via the Quickstarts and Learn ArcGIS lessons that are included in each chapter."
Seth Dixon's insight:
I haven't fully previewed this online textbook yet but I am VERY optimistic about this one from the ESRI library. You can also download the textbook as a PDF here. There are several other online textbooks that would interest geography teachers Tags: GIS, ESRI, mapping, cartography, geospatial, edtech, geography education, unit 1 GeoPrinciples, textbook.

Annenkov's curator insight,
August 5, 2015 4:30 PM
I haven't fully previewed this online textbook yet but I am VERY optimistic about this one from the ESRI library. You can also download the textbook as a PDF here. There are several other online textbooks that would interest geography teachers Tags: GIS, ESRI, mapping, cartography, geospatial, edtech, geography education, unit 1 GeoPrinciples, textbook.
"Learn how advances in geospatial technology and analytical methods have changed how we do everything, and discover how to make maps and analyze geographic patterns using the latest tools."

's comment November 6, 2013 9:41 PM
GIS is redefining mapping skills. In 21st Century education, it is crucial that we communicate GIS literacy in our geography curriculums and classrooms. As a geography teacher it is, therefore, also crucial that I have a thorough and sound knowledge of this field. This course could strongly assist such an understanding as professional development throughout my teaching career.
30-second animation of the changes in U.S. historical county boundaries, 1629 - 2000. Historical state and territorial boundaries are also displayed from 178...
Seth Dixon's insight:
I love this time-lapse animation of all the county and state-level boundary changes in United States history. Would you like to see this in greater detail? Would you want to download the data and create your own visualization of this? The Atlas of Historical County Boundaries has all of this data as GIS shapefiles, Google Earth KMZ files and PDFs for the whole country as well as for each individual state. This project sponsored by The Newberry and the National Endowment for the Humanities has tremendous potential for use in the classroom for history and geography teachers alike. Tags: historical, USA, borders, time lapse, mapping, edtech.

Betty Klug's curator insight,
April 27, 2013 3:50 PM
I love animation maps. Great for getting students interested in learning. 
Samuel D'Amore's curator insight,
December 14, 2014 6:36 PM
This video does a fantastic job of showing how the United States has expanded and grown since its original 13 colonies. While many today might imagine that our nation was simply always this size in fact over many years of colonization, land purchases and land grabs America has eventually become what it is today.

This map of Cuba, National Geographic's first map of Cuba in over 100 years, has an incredible backstory. While touring the National Geographic headquarters, the cartographer Juan Valdés (pictured here with me) told me the story of his early days living in Cuba before Castro, Pictured is one of his 36 meticulous drafts produced to create this cartographic masterpiece of his home country. To hear it in his own words, embedded in this link is a 18 minute video of his talk at National Geographic on Cuba and the production of the map. The last 7 minutes are especially helpful for mapping students to see all the decisions and stages involved in creating a professional reference map. Tags: cartography, mapping, National Geographic, Latin America.

Alyssa Dorr's curator insight,
December 16, 2014 9:54 PM
For starters, these pictures were fascinating to look at. It was amazing to see how much time and effort goes in making just one map. The video was informative and really gives you an idea of the unique process that is being done. The pictures fascinated me the most though. You could just tell just by looking at the pictures that they take what they do seriously. Also, you can tell that they are passionate about what they do. You can especially tell that you yourself had a great time and that you were really interested in what was going on. It is really awesome that National Geographic interviewed you about your visit. In the video, it was nice that he started off with some background information about Cuba and the special times that he shared with his father that made him go into cartography. Overall, the pictures and the video were really a sight to see. 
Jared Medeiros's curator insight,
February 11, 2015 10:11 PM
This was a great presentation. I cant imagine how long it must take to make an accurate map, especially when these cartographers are so passionate about their work and their craft. You can tell that to be a cartographer, you must be extremely passionate and dedicated to your craft. 
Rachel Phillips's curator insight,
April 16, 2015 4:58 PM
It's absolutely crazy to be that Juan Valdes had up to thirty-six different drafts of the map of Cuba, just to come up with the one, most accurate map of the country. When I see maps, I never think of how long it must have taken to get it exactly the way it is to be the most accurate map possible. It also makes me wonder how completely accurate our maps are, because when comparing multiple, you can see slight differences.
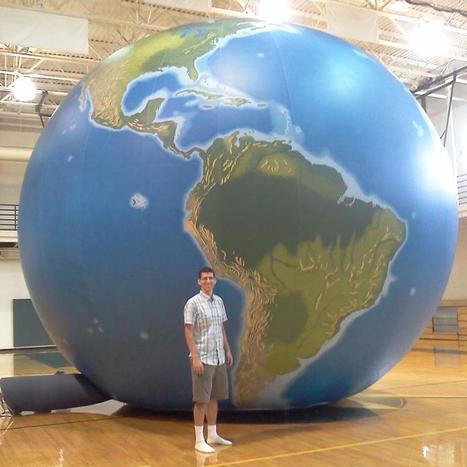
"EarthView is an educational outreach project of the Department of Geography at Bridgewater State University."
Bridgewater State is home to the Massachusetts Geographic Alliance and home to Project Earthview (I've never been so jealous of a globe before). This inflatable, hand-painted globe in a fantastic teaching resource. You can even enter the globe with a group under 20 and explore the Earth from the inside out. The link is to the Earthview blog, with provides information of the project to take this globe to local schools, and other geographic resources. UPDATE: This event was televised by WGGB with the clip now online.
|