Rhode Island Geography Education Alliance
15.7K views | +4 today
Follow
Rhode Island Geography Education Alliance
News, resources and professional development for the Rhode Island Geography Education Alliance http://rigea.org
Curated by Seth Dixon
Your new post is loading...
Scooped by Seth Dixon
Scoop.it!

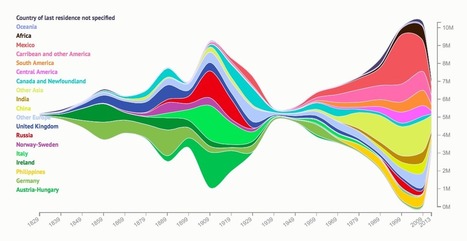
200 years of immigration to the U.S., visualized

200 years of immigration to the U.S., visualized | Rhode Island Geography Education Alliance | Scoop.it

"Where have immigrants to the U.S. come from? Natalia Bronshtein, a professor and consultant who runs the blog Insightful Interaction, created this fascinating visualization of the number of immigrants to the U.S. since 1829 by country of origin.  The graph hints at tragic events in world history. The first influx of Irish occurred during the potato famine in 1845, while the massive influx of Russians in the first decade of the 20th Century was driven by anti-Semitic violence of the Russian pogroms (riots). Meanwhile in the Austro-Hungarian Empire, army conscription and the forced assimilation of minority groups drove people to the U.S. in the early 1900s.  Since WWII, Central and South America and Asia have replaced Europe as the largest source of immigrants to the U.S. Immigration shrunk to almost nothing as restrictions tightened during WWII, and then gradually expanded to reach its largest extent ever in the first decade of the 21st Century."


Tags: migration, historical, USAvisualization.

David Holoka's curator insight, September 8, 2015 9:36 AM

The statistics in this article shocked me. I already new America took in a large number of immigrants, but I thought most came illegally from Mexico. Instead, the immigrants we hold are very diverse in ethnicity.  

Mrs. Madeck's curator insight, October 1, 2015 5:56 PM

Migration

Fred Issa's curator insight, October 5, 2015 4:24 PM

We tend to forget that the first real Americans were the Native American Indians. Immigration is a hotly discussed topic right now, but I wonder where we would be as a nation, if the original Native Americans told the settlers at Roanoke Island, the Chesapeake, and Plymouth Rock, that no, we are not allowing any foreigners to settle on our shores and land. Food for thought. Fred Issa,

Scooped by Seth Dixon
Scoop.it!

Population pyramids: Powerful predictors of the future

"Population statistics are like crystal balls -- when examined closely, they can help predict a country's future (and give important clues about the past). Kim Preshoff explains how using a visual tool called a population pyramid helps policymakers and social scientists make sense of the statistics, using three different countries' pyramids as examples."

Seth Dixon's insight:

This is an incredibly powerful and remarkably well-done TED-ED lesson on the importance and value of population pyramids.  This lesson goes nicely with this article fro the World Bank entitled "The End of the Population Pyramid" which highlights the demographic changes that will be reshaping global demographics in the next 50-100 years.  


Tag: population, demographic transition model, TED.

Nancy Watson's curator insight, September 26, 2014 4:04 PM

Population unit

Lauren Quincy's curator insight, March 20, 2015 1:51 PM

Unit 2: Population and Migration


This video was about how demographers categorize data and analyze it. This video showed a few different population pyramids in order to show differences in population in different countries. It showed China as an example and pointed out the remnants of the one child policy 35 years before and how the number of men were higher due to sex selective abortions. They also talked about how the population pyramids could show what stage in the demographic transition model a country was in and how they use them to predict future patterns and changes. 


This relates to unit 2 because it covers topics such as population change, demographic transition models, sex composition, population policies and much more. Population pyramids are very useful due to the visualization of sex, age and number composition in a countries population. They are very important in the use of predicting the future change in population because it can tell what the population has gone through in the past and what to expect in the DTM. 

Daniel Lindahl's curator insight, March 21, 2015 10:43 PM

This video illustrates how population pyramids have the ability to show how populations will rise and fall over time. Pyramids specifically show the population based on a specific age, and illustrates a country's amount of young people in comparison to the elderly.